
Data Wizards
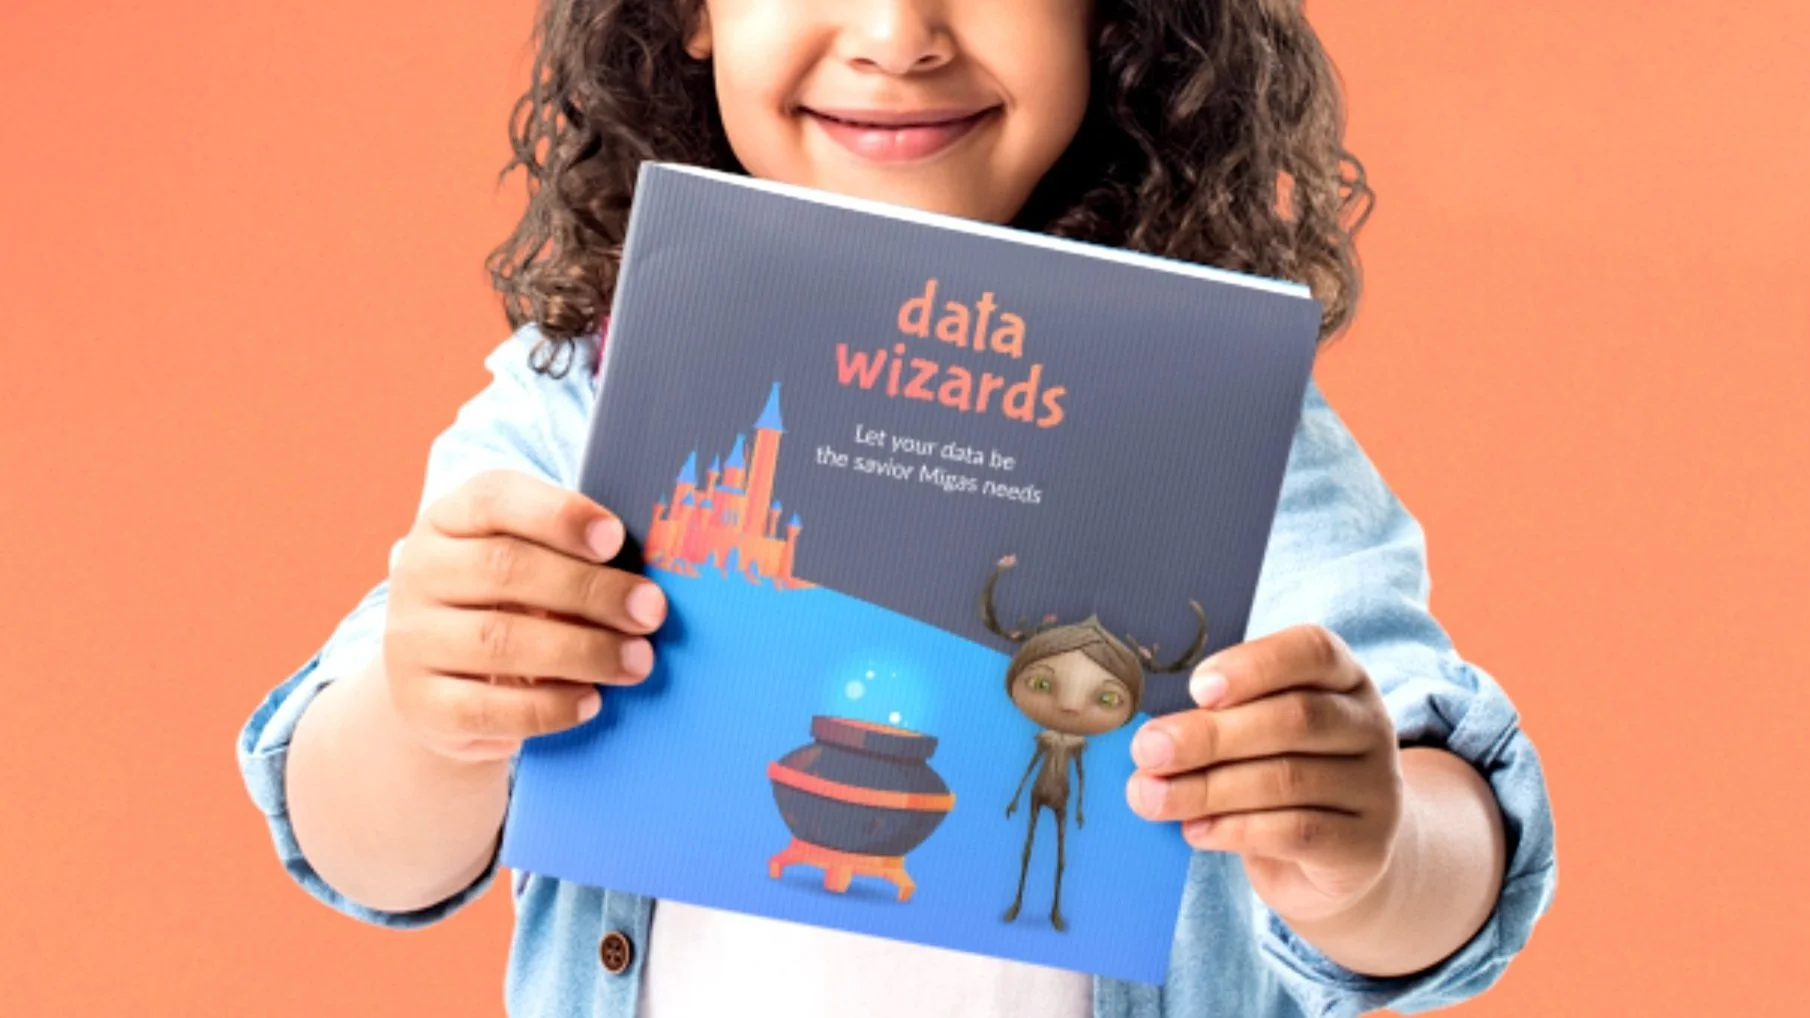
Data Wizards is a product that teaches data science to kids by immersing them into the stories and augmented diagrams.
It is an expanded book which ventures into an application and augments into the real world by combining the real and the story world together.
Kids meet the story characters and get to know them based on the choices that they make through the journey. The real world activities affects the story world. In this journey kids help the characters, through data. They record their data, and see the result of the visualised data in an augmented way, walk around them and, grasp insights.


Project background
The world we know is changing. The importance of data science and data visualisation has never been so high. The increased popularity of big data and data analysis projects have made visualisation more important than ever. Companies are increasingly using machine learning to gather massive amounts of data that can be difficult and slow to sort through, comprehend and explain. Since it is so common and used in everyday dealings, it is essential for today's children to embrace this and get a hold of the conception from the very beginning. Therefore, this project tackles the idea of teaching children data visualisation through an app. Furthermore, AR is gaining more and more popularity in educational apps. This is because Augmented Reality (AR) in education features aspects that enhance learning of abilities like problem-solving, collaboration, and creation to better prepare students for the future. It is also good for traditional pedagogy focused on technical knowledge and proficiencies. Therefore, this product will be an expanded reality product. A human-centered approach was adapted to design this product. Plenty of exploration and research later, a product was defined. The result was an immersive storybook that taught children data visualisation known as Data Wizards. This product was tested multiple times, reiterated according to the insights gathered. Data Wizards is a gamified approach to the concept of data visualisation. A story world was built, where young mages depend on the user’s data entries. Through user tests, we deduced that this world works and appeals to children and manages to communicate basic data visualisation topics to the user.
Project goal
I had worked on several projects to develop data visualisation software and knew the importance of this knowledge. This concern motivated me in my master's thesis project to develop a data learning product for children. I worked on this project in collaboration with one of my classmates, Taneem Abid, who had a similar background and goal. We defined our project as "kids of today, data communicators of tomorrow" and hope to help the new generation learn the basics of data science in a fun and engaging way that they can apply in their professional careers in the future.
My role and responsibilities
I took the responsibilities for project management, planning, facilitating design thinking process, creating a UX research plan for user research, analysing the competitors, creating competitor audits, structuring the application , designing interactions and visuals of the prototypes, and delivering high-fidelity prototype.
User Research
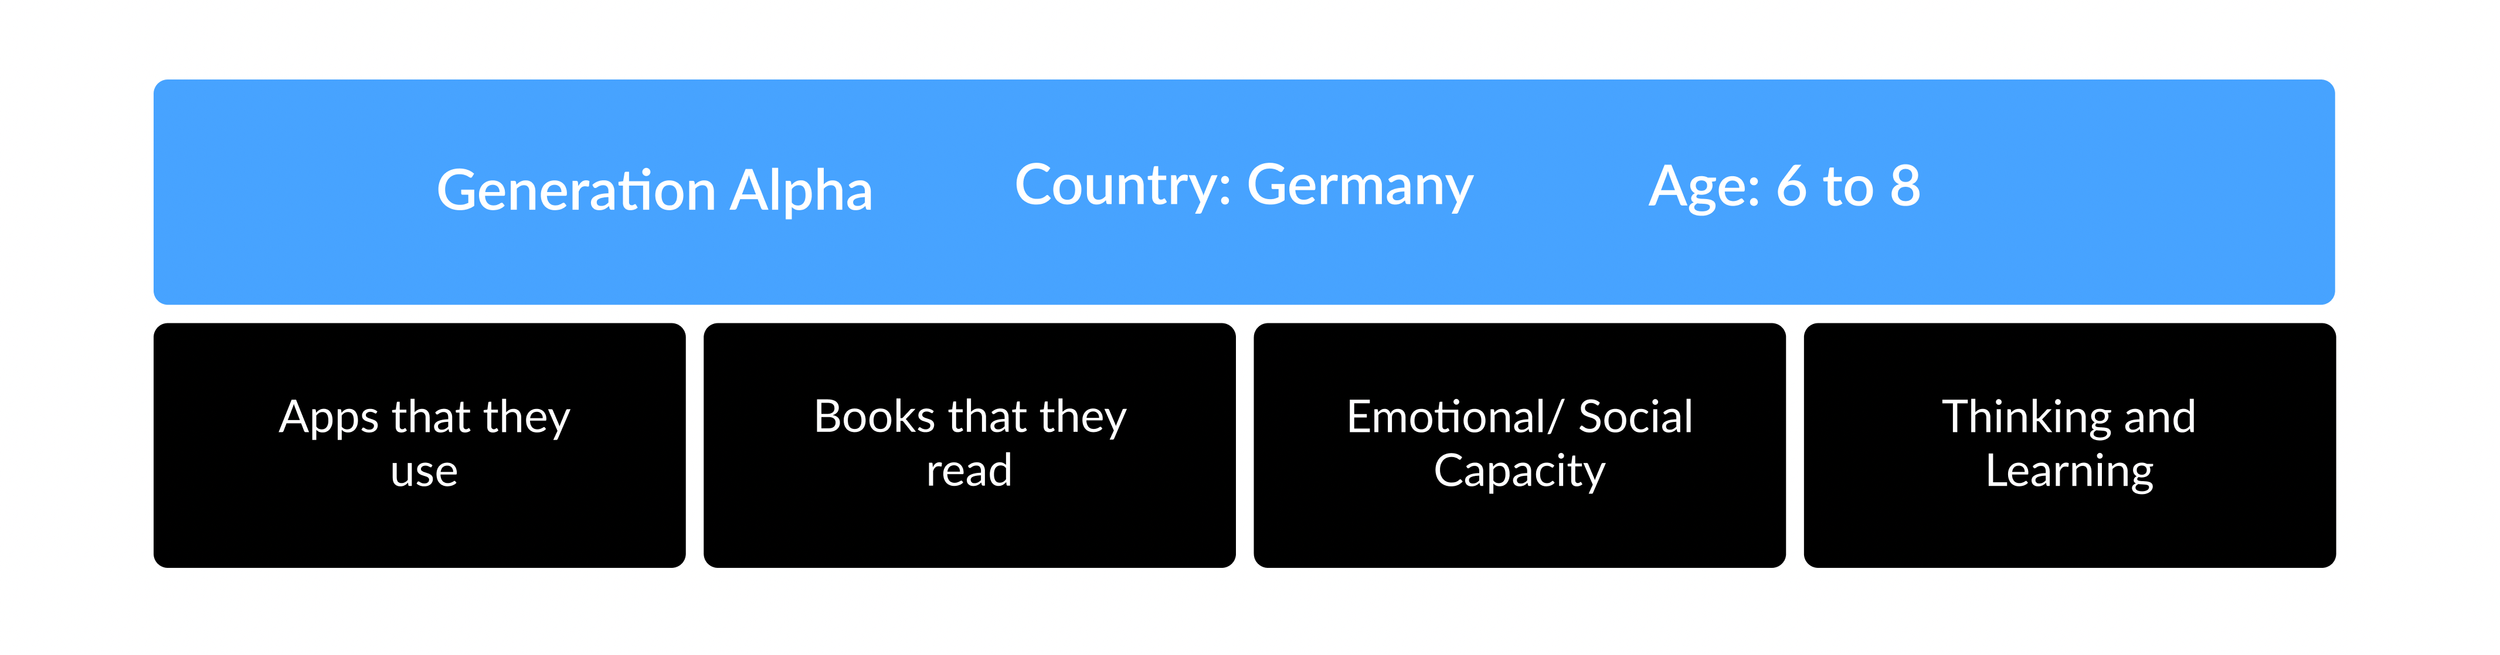
Target group

Scratching the Surface
The figure shows some important results of the survey

Interviews and insights
Definition
Roadmap


Pain Points
IA


Sketches
We have started sketching with initial understanding of the problem. By doing more research and clarifying the pain points we could iterated them and reach the acceptable flow.
Sketches of initial concepts


Sketches of prototyped concept

Wireframes
We designed digital wireframes on Figma and created low-fidelity prototype. So that, we could test the interactive low-fidelity prototype on the users and gather the feedback and improve the flow.


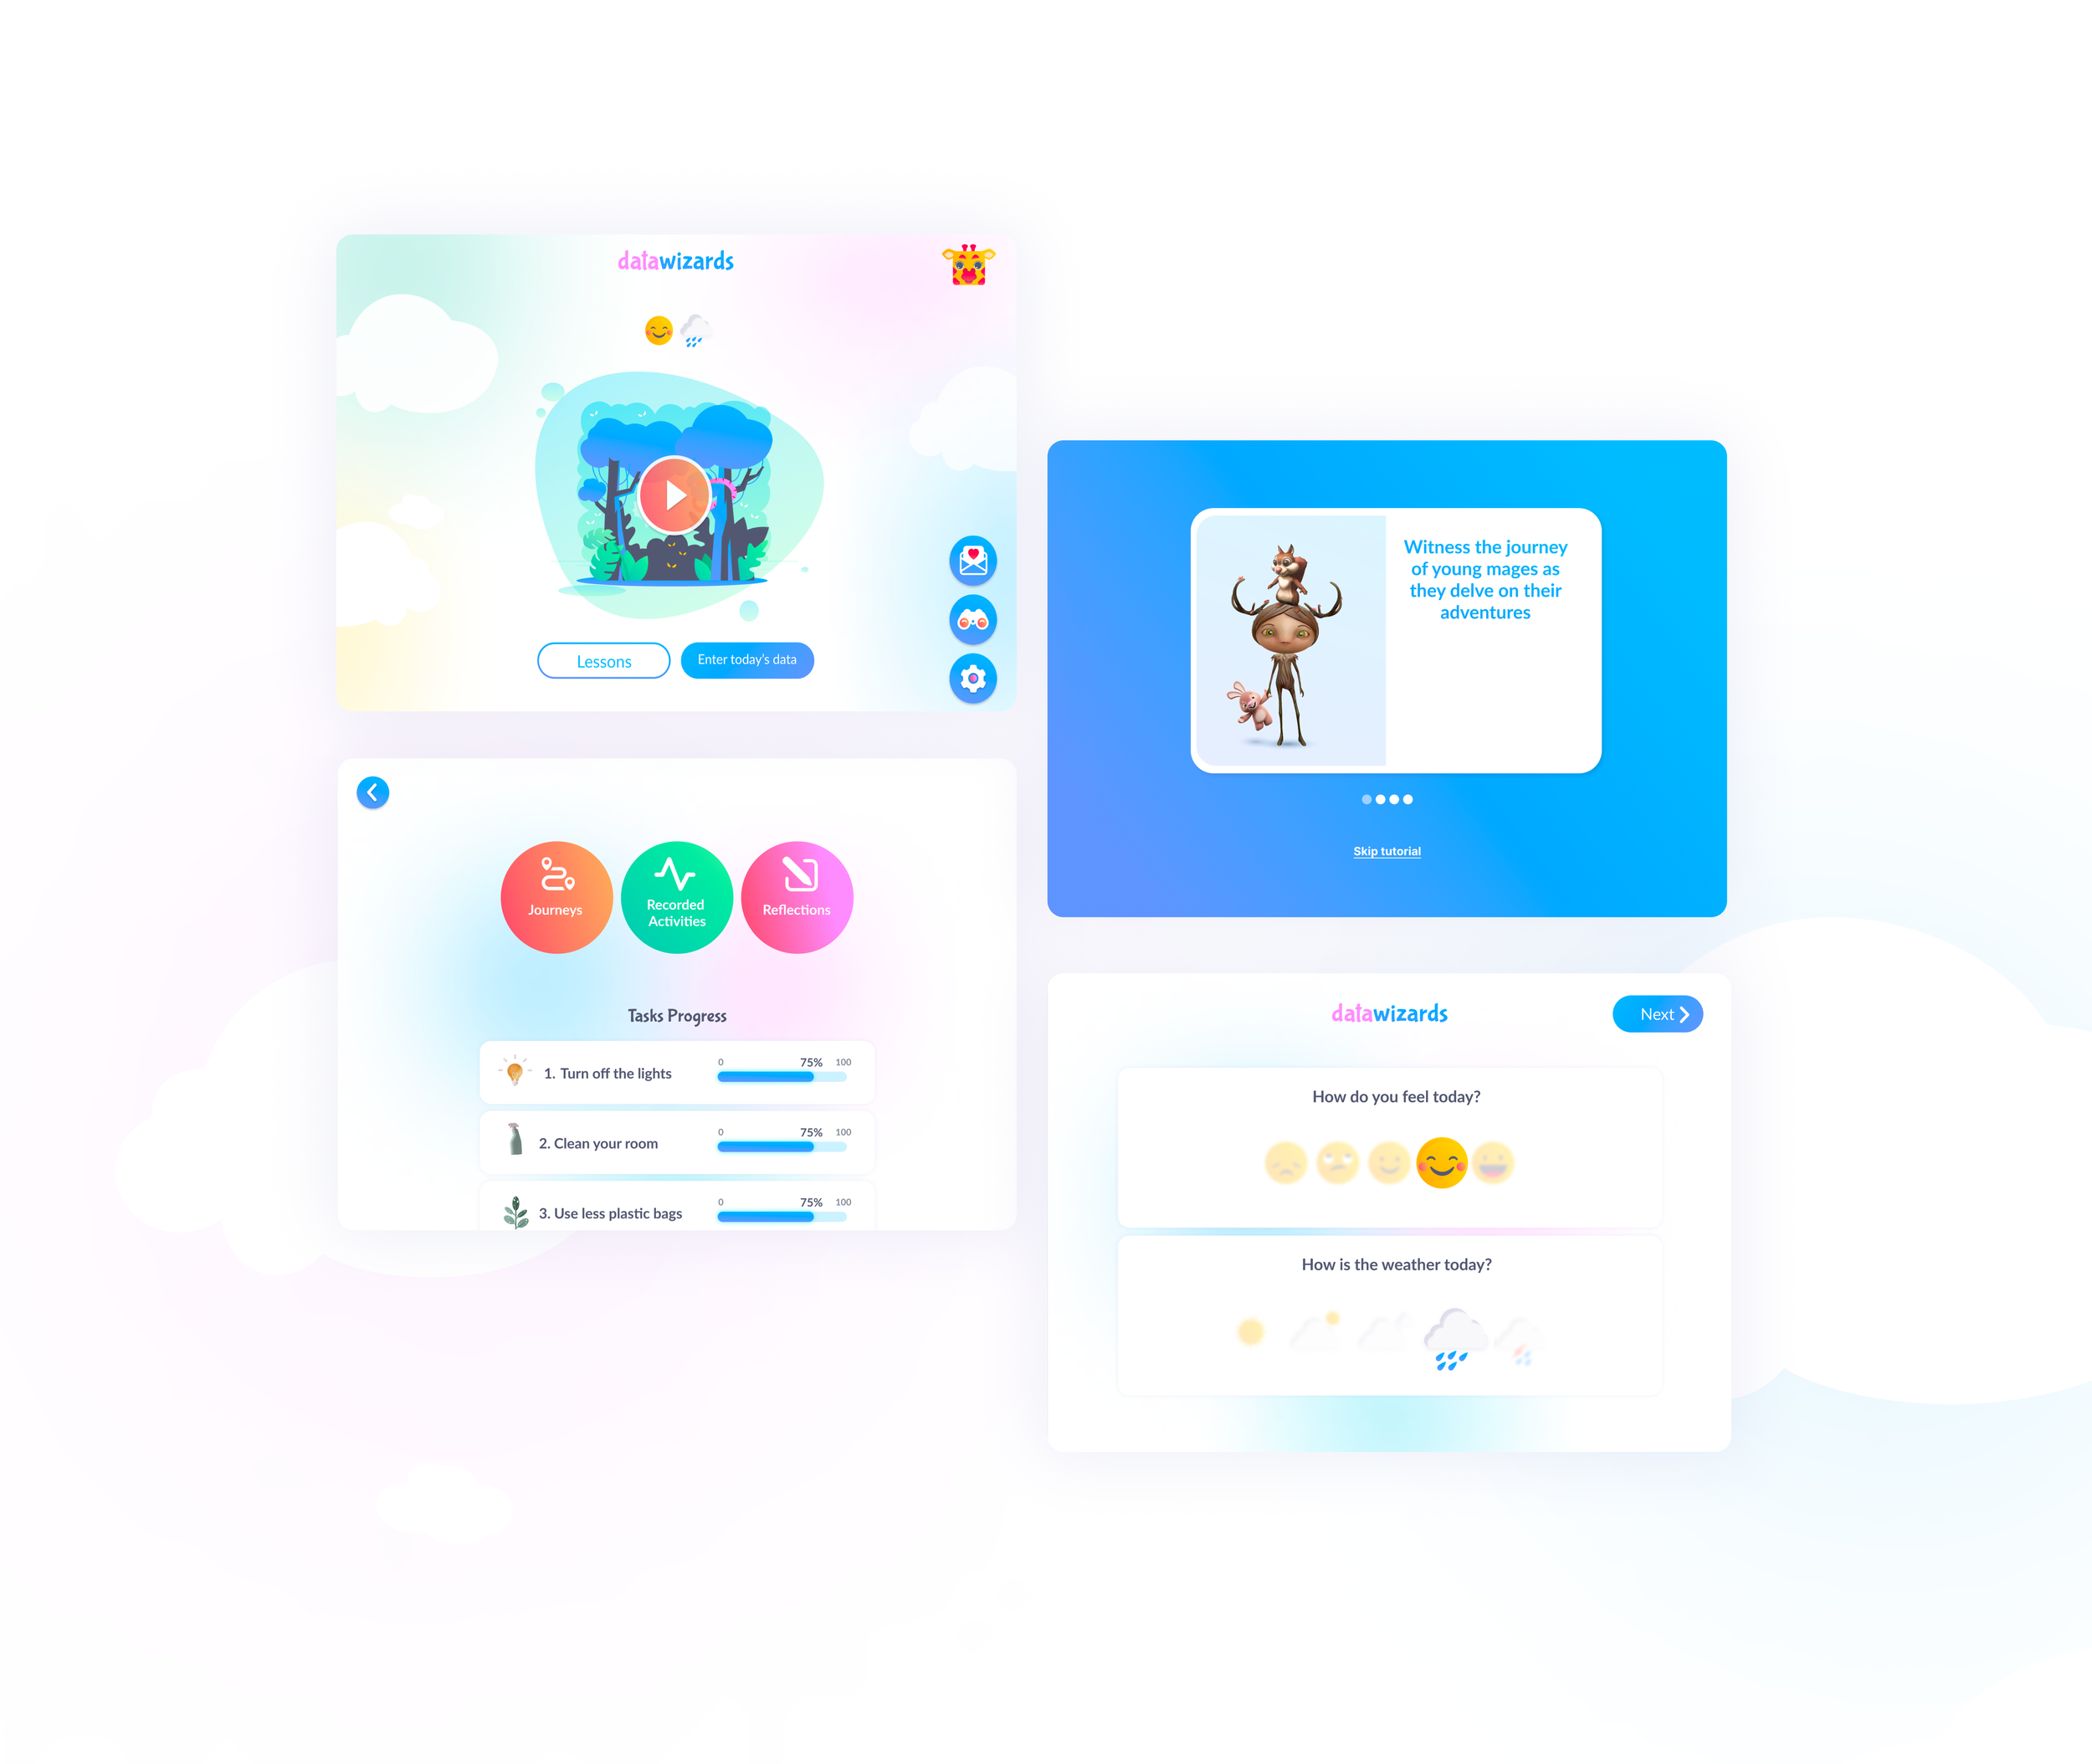
High fidelity prototype

Design library


User Interface

Learning data science in Data Wizards
This part was one of the challenging parts of the project because we had no knowledge about data science. So we started learning about it; we interviewed four data scientists and started gathering information about it. The questions we asked ourselves were: Why is it important to learn data science? What are data visualisation techniques? How can kids learn it? What techniques can kids learn?

Data visualisation techniques that kids learn in Data Wizards
Visualised data of the first level
We started sketching AR data visualisation for the first level and checked them with the data scientists and did iterations on it. We implemented final scene prototype on Unity 3D.


Data Entry

Expanding the world of Migas into AR
We used Adobe Aero to expand our story world. By scanning the pages of the book, the story world expands in the real world and the characters come into the children's room.


